Supply and distribution of products
Supply and distribution of products
There are two kind of information in different archives of the Centre. It is row data and basic kinds of processed data for last month. Other kinds of processed data may be delivery by a request, witch can be done throw E-mail contact@iacp.dvo.ru or request forms of this site.
The current observed greay-scale pcx-files can be viewd at the ftp.
Two kind of projection format are produced
- 1 byte and 2 byte on pixel. Also the formats differ in structure of 0-block (the first 512 bytes - descriptor).
|
Digital data
|
graphical files
(PCX, GIF) for visualization |
regularity |
|
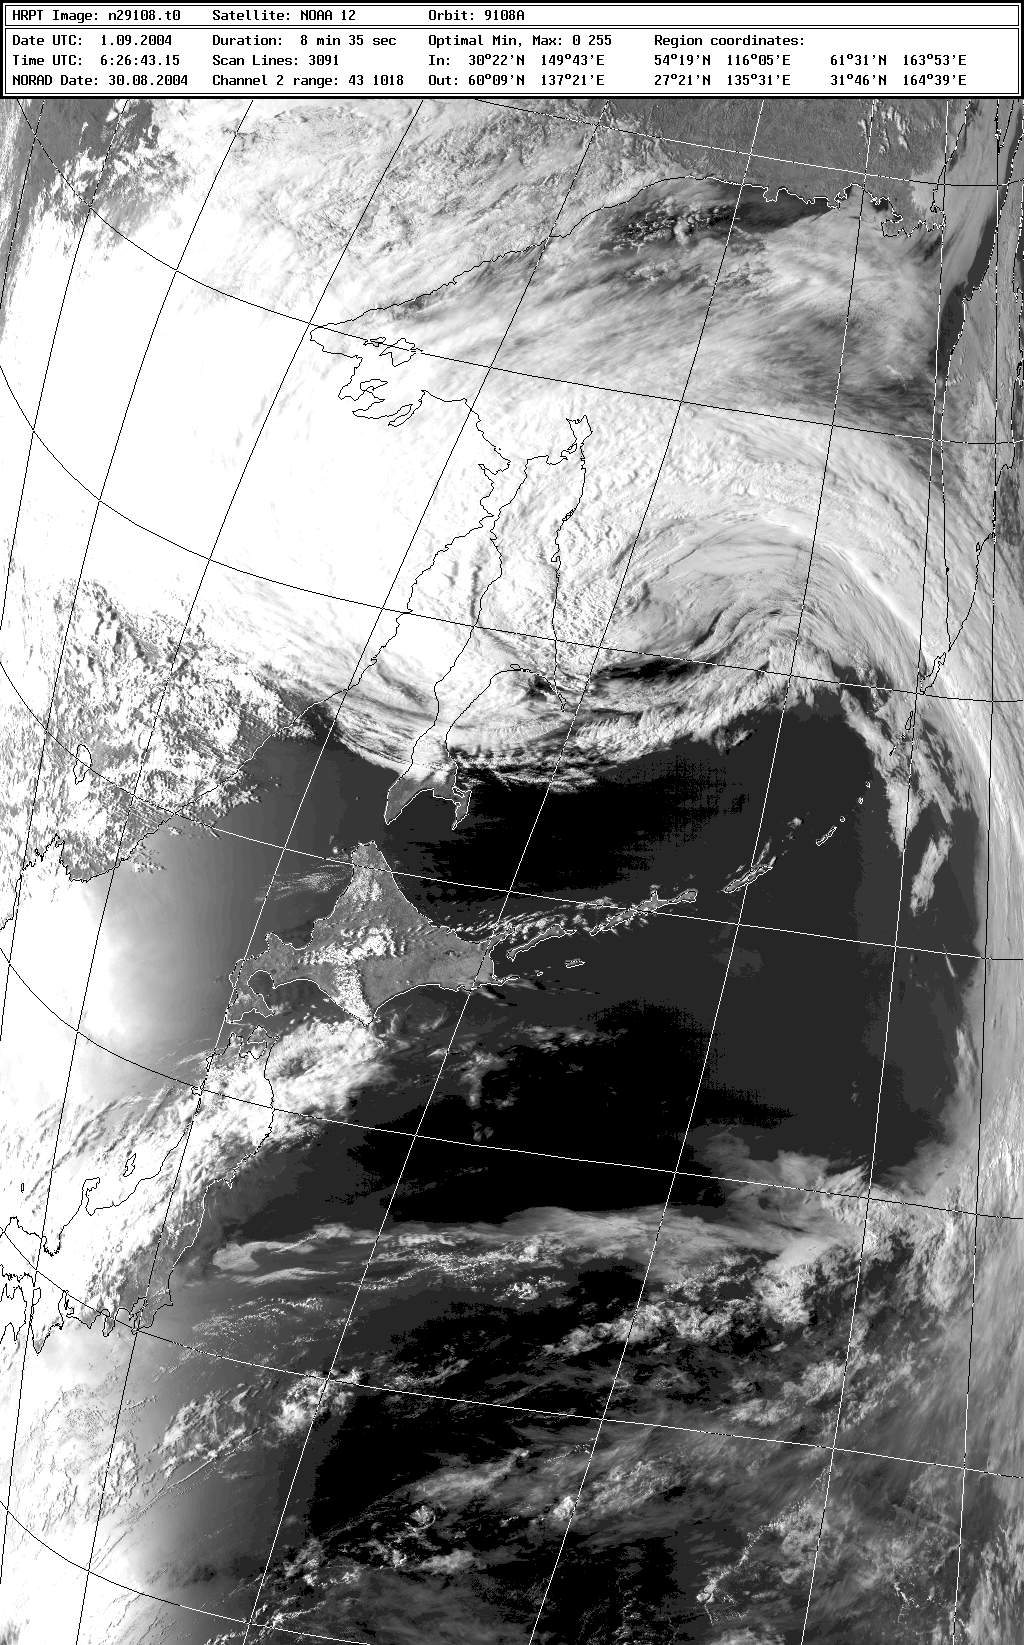
1 metadata of satellite reception:
text catalogs of the recepted information with some satellite image characteristics |
observed Greay-scale PCX +
Time, date, scan parameters + dynamic changing of scale and brightness resolution, navigation net, land couture, and any quantity information of the image |
Each satellite pass |
|
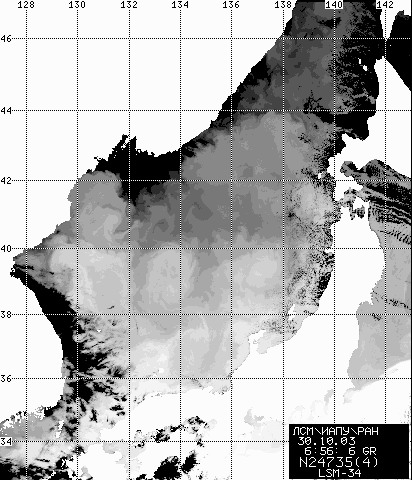
2 Image in Mercator projection (IMP) of original resolution
for all channels of britness |
1. Image in mercator project with geographical net (N) and land (C) contour (gray palette) basic data
2. IMP_NC+DOTC+ temperatore(T) (24 color palette), T step - 1° С and 48 color palette, T step 0.5° С |
for each sea region selected |
|
3 Composed temperature of 20х20 км square averaging |
PCX/GIF T in isolines, T step - 1° или 0.5° |
every ten days |
|
4 DOTC averaged for 10 days |
Composed DOTC chart |
every 10 days |
|
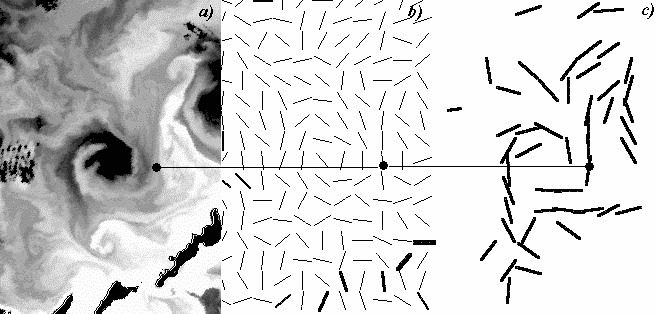
5 IMP_NC + flow current vectors |
appropriate PCX/GIF file |
by request |
|
6 IMP_NC, + hydrological station locations and etc. |
appropriate PCX/GIF file |
by request |
|
7 IMP_NC + different channels |
appropriate PCX/GIF file |
by request |
|
8 eddies characteristics |
appropriate table |
by request |
Copyright © Спутниковый мониторинг окружающей среды, ДВО РАН Все права защищены. Опубликовано на: 2005-01-27 (6568 Прочтено) [ Назад ] |


